Role

Team Member — Experimental Aerodynamics

AE 315: Experimental Aerodynamics · ERAU · Spring 2025

Tools

MATLAB · Wake Survey (Pitot-Static Probe)
DAQ / ADC Data Acquisition System · Servo Microcontroller
Trapezoidal Integration · Error Propagation (95% CI)

Key Contributions

  • Operated ERAU’s open-loop subsonic wind tunnel and servo-controlled flap system across five deflection angles
  • Acquired wake velocity profiles via traversing pitot-static probe and processed pressure data through the MATLAB DAQ pipeline
  • Computed drag forces and drag coefficients using momentum-deficit wake integration with full uncertainty propagation
  • Analyzed the drag trend from 0° to 50° flap deflection and attributed the non-linear behavior at 25° to potential flow reattachment
5
Flap Deflection Angles Tested
2.20 N
Peak Drag (Full Flap, 50°)
0.220
Max Cd (50° Deflection)
<0.06 N
Uncertainty Across All Trials

This page documents a wake survey experiment in ERAU’s subsonic wind tunnel, where I measured how drag on a NACA 4412 wing changes across five flap deflection angles, computed drag coefficients via momentum-deficit integration, and propagated measurement uncertainty to 95% confidence.

Project Overview

Control surfaces such as flaps are central to every phase of flight — increasing lift during takeoff and approach while simultaneously raising drag. Understanding this tradeoff experimentally, not just analytically, is essential for validating aerodynamic models. In this study, we used ERAU’s open-loop subsonic wind tunnel and a servo-actuated NACA 4412 wing model to directly measure how drag evolves as flap angle is swept from fully retracted to fully deflected. Wake survey methods — where the velocity deficit behind the airfoil is integrated to infer drag — provided a classic, non-contact drag measurement technique rooted in the momentum theorem.

Experimental Setup

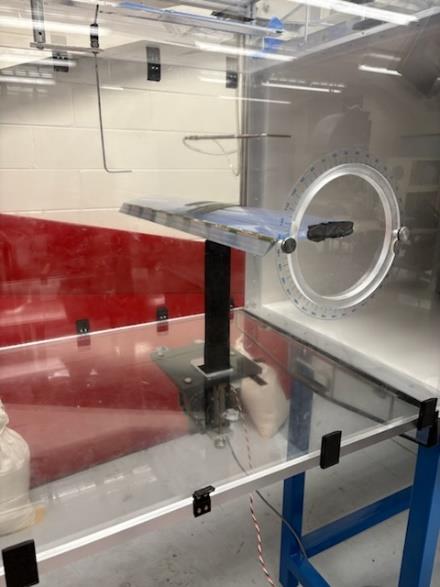
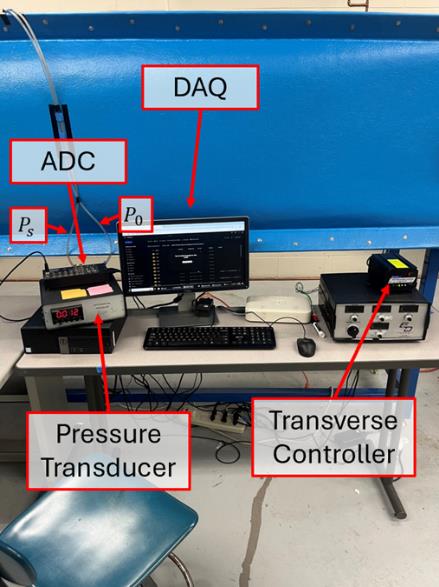
Testing was conducted in ERAU’s open-loop subsonic wind tunnel. The transparent-walled test section allowed direct observation of the instrumentation throughout each run. Two pitot-static probes were deployed simultaneously: a stationary probe to record freestream conditions and a motorized traverse probe to sweep through the wake region behind the wing. Pressure readings were fed to analog and digital manometers and captured by the data acquisition system.

Wind tunnel test section with labeled instrumentation: pitot-static probes, manometers, and fan speed controller
Fig. 1: Open-loop subsonic wind tunnel test section. The traversing pitot-static probe (center) swept the wake profile behind the mounted airfoil; a second stationary probe captured freestream reference pressure.

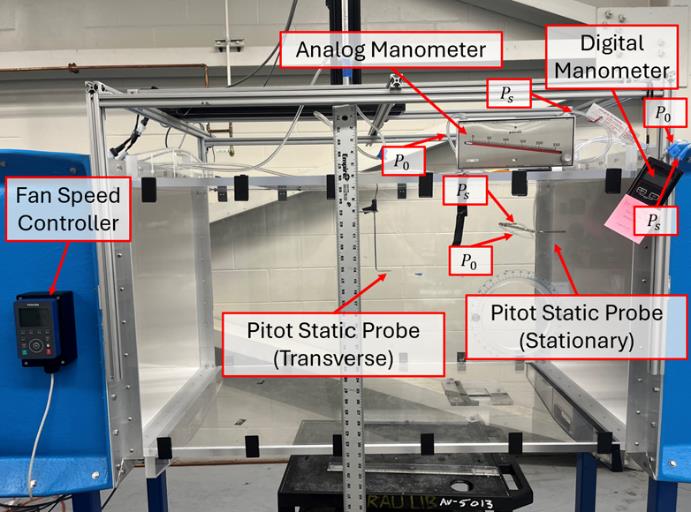
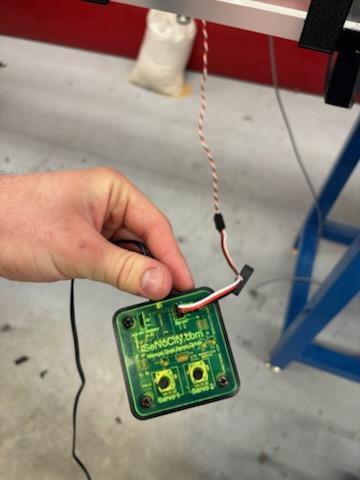
The flap deflection system was custom-built: a servo microcontroller (ServoCity) interfaced with servos embedded in the wing allowed precise, repeatable angular positioning between test runs. A DC power supply regulated voltage to the servo system. Ambient conditions were logged before each sweep, enabling accurate air density calculation at each test condition:

Servo microcontroller board used to actuate the flap deflection mechanism on the wing model
Fig. 2: Servo controller board used to command discrete flap deflection angles between tunnel runs.

The data acquisition pipeline ran a MATLAB script on the DAQ computer to log pressure data from the analog-to-digital converter (ADC) in real time, automatically step the traverse probe through programmed height increments, and export processed velocity profiles for post-processing.

Data acquisition station with DAQ computer, ADC, pressure transducer, and transverse controller
Fig. 3: DAQ computer station. The MATLAB acquisition script controlled both data logging and the traverse probe’s step-motor position during each wake sweep.

The NACA 4412 wing was mounted to a force balance spanning the test section at a fixed angle of attack. During installation, the wing’s structural attachment failed at the initially commanded angle, requiring the model to be re-secured using electrical tape, with wingtip friction against the tunnel walls providing additional lateral support.

Design Decision

Trade-off: Continued testing with an improvised mounting fix (electrical tape and wingtip friction) rather than halting the session to rebuild the structural attachment.

Why: Rebuilding the mount would have consumed the remaining lab session time budget. The improvised fix held the model steady enough to complete all five sweeps, and the resulting mounting instability was carried forward explicitly as an additional uncertainty source in the final analysis rather than ignored.

NACA 4412 wing with full flap deflection installed in the wind tunnel test section
Fig. 4: NACA 4412 test article at full (50°) flap deflection, mounted inside the test section. The circular force balance mount is visible at the far wall.

Wake Survey Method & Drag Calculation

Drag was inferred from the momentum deficit in the wake rather than from a direct force measurement. According to the momentum theorem, the drag per unit span D′ is proportional to the velocity deficit integrated across the wake height:

D′ = ρ ∫ Uw(U − Uw) dy

where U is the undisturbed freestream velocity and Uw is the local velocity in the wake. Numerical integration used MATLAB’s trapezoidal method over the traverse probe sweep. Drag coefficient was then derived as:

Cd = D′ / (½ ρ U2 c)

Uncertainty in drag was propagated from three independent sources using the sum-of-squares method at 95% confidence:

Results & Discussion

Wake velocity profiles across all five flap configurations are overlaid in Figure 5. At low deflection angles the wake velocity deficit is narrow and shallow, centered near height y = 0.32 m. As flap angle increases to 50°, the deficit broadens noticeably — the wake extends further in the transverse direction, indicating greater momentum extraction by the wing and, by consequence, higher drag. This widening is the visual signature of increased pressure drag driven by flow separation behind the deflected flap surface.

Wake velocity profiles at 0, 15, 25, 35, and 50 degree flap deflections plotted as velocity vs. height
Fig. 5: Wake velocity profiles at each flap deflection angle. Higher deflection angles produce a wider, deeper velocity deficit — direct evidence of increased drag.

The drag coefficient Cd versus flap deflection is plotted in Figure 6 with 95% confidence error bars. The trend is predominantly increasing — Cd rises from 0.200 at 0° to 0.220 at 50° — consistent with the expected growth in pressure drag from enhanced flow separation. A small dip to Cd = 0.191 at 25° breaks the otherwise monotonic trend. This anomaly could reflect minor flow reattachment at that intermediate angle, measurement scatter from the mounting instability, or a combination of both. At higher Reynolds numbers or with a more rigidly mounted model, finer angle increments would be needed to resolve whether this dip is physically real or experimental artifact.

Design Decision

Trade-off: Tested only five flap angles (0°, 15°, 25°, 35°, 50°) across the full deflection range, rather than sampling more densely around the 25° dip to determine whether it was physical or noise.

Why: Each configuration required a full tunnel run and probe traverse, so five angles were chosen to characterize the overall trend within the lab session’s time budget. The coarser spacing left the 25° anomaly unresolved — an accepted gap rather than a flaw, since the primary goal was establishing the monotonic drag-vs-deflection relationship, not resolving local features.

Drag coefficient C_d plotted against flap deflection angle from 0 to 50 degrees with error bars
Fig. 6: Cd vs. flap deflection (0°–50°) with 95% confidence error bars. The overall trend confirms increasing drag with deflection; the local minimum at 25° warrants further investigation.

Drag Force Summary

Flap Deflection Drag (N) Uncertainty (N) Cd
0° (Flap Retracted) 1.8824 ± 0.0443 0.200
15° 1.9636 ± 0.0493 0.205
25° 1.8328 ± 0.0426 0.191
35° 1.9277 ± 0.0482 0.199
50° (Full Flap) 2.2000 ± 0.0587 0.220

Drag uncertainty grew with deflection angle, reaching a maximum of ±0.059 N at 50° — roughly 2.7% of the measured drag value. This indicates the repeatability of the wake survey method was maintained across all test conditions despite the structural instability of the mount.

Key Takeaways

Flap deployment carries a measurable drag penalty confirmed by wake survey.

Drag force rose 16.9% from 1.882 N at 0° to 2.200 N at full flap (50°). The corresponding Cd increase from 0.200 to 0.220 directly quantifies the cost in aerodynamic efficiency that operators accept in exchange for the lift benefit during takeoff and landing.

Wake width is a direct visual indicator of drag magnitude.

The traverse velocity profiles revealed that the wake deficit broadened progressively with flap angle. This one-to-one relationship between wake width and drag — predicted by the momentum theorem — was confirmed experimentally, reinforcing the physical basis of the measurement technique used in this study.

Non-monotonic behavior at intermediate angles highlights the limits of coarse angle spacing.

The dip at 25° — where drag fell below both the 15° and 35° values — could not be definitively attributed to physics or experimental error with only five data points. Denser sampling between 20° and 30° and a more rigid model mount would be required to distinguish flow reattachment from measurement noise.

Uncertainty propagation gives confidence intervals that reflect real physical variability, not just instrument resolution.

By propagating errors from pressure, atmospheric temperature, and statistical scatter in dynamic pressure through the drag integral, the final uncertainties (±0.043 to ±0.059 N) captured contributions from both instrumentation and flow unsteadiness. All five measurements remained distinct within their 95% confidence bands, confirming the wake survey resolved meaningful differences between deflection angles.

← Back to Aerospace Projects